title, subtitle, author, date, geometry, output, header-includes
| title | subtitle | author | date | geometry | output | header-includes | ||
|---|---|---|---|---|---|---|---|---|
| Security and Privacy - Assignment 4 | Privacy-Preserving Data Publishing |
|
2022-06-02 | margin=2cm | pdf_document | \usepackage{float} \let\origfigure\figure \let\endorigfigure\endfigure \renewenvironment{figure}[1][2]{\expandafter\origfigure\expandafter[H]}{\endorigfigure} |
\vspace{3em}
Attribute classification
We classified the attributes as follows:
\vspace{3em}
Attribute | Classification
-----------------+---------------
age | QID
workclass | Insensitive
fnlwgt | Insensitive
education | QID
education-num | QID
marital-status | QID
occupation | QID
relationship | QID
race | QID
sex | QID
capital-gain | Sensitive
capital-loss | Sensitive
hours-per-week | QID
native-country | Insensitive
prediction | Insensitive
Table: Attribute classifications
\pagebreak
Justifications
The vast majority of attributes present low values of distinction. This is consistent with the nature of
the dataset, considering that fnlwgt should indicate the quantity of individuals that present the same
set of attributes.
age
According to HIPPA recommendations, and together with it's very high separation value (99.87%), we classify this attribute as a QID.
workclass
This attribute presents a relatively low separation value (49.71%), and given how generic it is, it's deemed Insensitive.
fnlwgt
Despite high values of distinction (66.48%) and separation (99.99%) the fnlwgt column is not a QID
because it represents a weight, not a count of individuals in the same equivalence class in the
original dataset. This can be seen with the results below. Additionally, it's not easily connected
to other auxiliary datasets.
$ tail -n '+2' adult_data.csv | awk -F',' '{count[$10] += $3;} \
    END {for(sex in count){print sex, count[sex]}}'
Resulting in:
Sex | Sum -------+-------- Female | 2000673518 Male | 4178699874
Table: Sum of fnlwgt for each sex
The sum of these values is 6,179,373,392. This value is much larger than the population of the U.S.A., the origin of the dataset, which implies this attribute is not a count, as stated.
We also note there are substantially more Male than Female records,
being that the sum of fnlwgt for Male is more than double that of
Female, as well as that the number of rows with Female is 10771 and
for Male is 21790.
education
This attribute presents a separation of 80.96%, which is quite high, thus we classified it as a QID.
\vspace{-3em}
education-num
We used the following command to verify there weren't any
discrepencies between the education and education-num columns:
$ cat adult_data.csv | awk -F',' '{print $5, $4}' | sort -un
Since there was a one-to-one mapping, we confirmed this was just a
representation of the education attribute. As such, this attribute
recieves the same classification, which is backed by the equally high
separation value of 80.96%, so it's classified as a QID.
\vspace{-1em}
marital-status
With a relatively high separation value of 66.01%, together with the fact that it could be cross referenced with other available datasets, we classify this attribute as a QID.
occupation
With a separation of 90.02%, this attribute is classified as a QID.
\pagebreak
relationship
Given it's separation value of 73.21%, this attribute is classified as a QID.
race
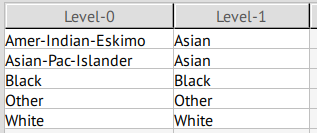
This collumn presents some weirdly specific values (Amer-Indian-Eskimo), but has a separation of 25.98%; given the fact that this attribute could be cross referenced with other datases, it is classified as a QID, so it may be transformed into more generic values.
sex
Despite the low separation value of 44.27%, this attribute is canonically classified as a QID, since it can be easily cross referenced with other datasets.
We noted this dataset seems to have more males than females. See Table 2 and the following table
education | Female | Male
-------------+-------:+----:
Preschool | 16 | 35
1st-4th | 46 | 122
5th-6th | 84 | 249
7th-8th | 160 | 486
9th | 144 | 370
10th | 295 | 638
11th | 432 | 743
12th | 144 | 289
HS-grad | 3390 | 7111
Some-college | 2806 | 4485
Assoc-voc | 500 | 882
Assoc-acdm | 421 | 646
Bachelors | 1619 | 3736
Masters | 536 | 1187
Prof-school | 92 | 484
Doctorate | 86 | 327
Table: Number of records with each education for each sex
capital-gain & capital-loss
With a separation of 15.93% and 9.15% respectively, these attributes are not QIDs. They're qualified as Sensitive, as the individuals may not want their capital gains and losses publicly known.
A t-closeness privacy model was chosen for these attributes, with a value of t of 0.2. This reasoning is discussed in Applying anonymization models > k-Anonymity > Effect of parameters
hours-per-week
This attribute has a relatively high separation (76.24%) and since it had really unique values, it could be cross referenced with another dataset to help identify individuals, so it's classified as QID.
native-country
While this attribute might be regarded as a QID, it presents really low separation values (19.65%) in this dataset, so it's qualified as Insensitive.
prediction
This is the target attribute, the attribute the other attributes predict, and is therefore Insensitive.
Privacy risks in the original dataset
In the original dataset, nearly 40% of records have a more than 50% risk of re-identification by a prosecutor. In general, we see a stepped distribution of the record risk, which indicates some privacy model was already applied to the dataset, however to a different standard than what we intend.
All records had really high uniqueness percentage even for small sampling factors, according to the Zayatz, Pitman and Dankar methods. Only SNB indicated a low uniquess percentage for sampling factors under 90%. What this means, is that with a fraction of the original dataset, a very significant number of records was sufficiently unique that it could be distinguished among the rest, which means it's potentially easier to re-identify the individuals in question.
All attacker models show a success rate of more than 50%, which is not acceptable.
Applying anonymization models
k-Anonymity
We opted for 8-anonymity, for it's tradeoff between maximal risk and suppression.
t-closeness was chosen for capital-gain and capital-loss
(sensitive attributes).
Re-identification risk
The average re-identification risk dropped to nearly 0%, whereas the maximal risk dropped to 12.5%. The success rate for all attacker models was reduced drastically, to 1.3%.
Utility
Definitions
Precision
Measures data distortion, equated to the Generalization Intensity (Gen. Intensity) of attribute values. [1]
Information Loss
Measures the extent to which values are generalized. It summarizes the degree to which transformed attribute values cover the original domain of an attribute. It is equated to the converse of Granularity.
Classification Performance
Measures how well the attributes predict the target variable
(prediction, in this case).
Discernibility
Measures the size of groups of indistinguishable records and with a penalty for records which have been completely suppressed. [3]
Average class size
Measures the average size of groups of indistinguishable records. [4]
\pagebreak
Analysis
The original Classification Performance, was 83.24% and it remained at 82.45%.
10.07% of attributes are missing from the anonymized dataset. This
value being equal across all atributes suggests entire rows were
removed, rather than select values from separate rows. The only
exception is the occupation attribute, which was entirely removed.
The high values for Generalization Intensity and Granularity suggest a moderate ammount of information loss and a loss of precision.
The values for Discernibility and Average Equivalence Class Size are also high. And in general, all the quality models (both attribute-level and dataset-level) are high.
However, given the classification performance is maintained, this was deemed acceptable.
Effect of parameters
At a suppression limit of 0%, the same accuracy is maintained, but the vast majority of QIDs are entirely removed.
At a suppression limit of 5%, roughly the same prediction accuracy is
maintained, with around 4.5% of values missing, however with really
high Generalization Intensity values for some attributes (e.g. 95.42%
for sex, 93.87% for race and 91.47% for education and
education-num). occupation was entirely removed.
At a suppression limit of 10%, the prediction accuracy is maintained, with around 9.8% of values missing. However, the Gen. Intensity drops to around 90%.
At a suppression limit of 20%, accuracy is maintained, once again, with around 10% of values missing, indicating this would be the optimal settings, as the same results are achieved with a limit of 100%.
At a t-closeness for capital-gain and capital-loss t value of
0.001 (the default), anonymization fails, not producing any output.
At a t value of 0.01, accuracy drops to 75% and most attributes have missing values of 100%.
At a t value of 0.1, classification accuracy is nearly 81%, but missings values are around 20%.
At a t value of 0.2, the chosen value, the accuracy is 82.5% with lower Gen. Intensity values.
At a t value of 0.5, the classification accuracy goes to 82.2% with increased Generalization Intensity values.
Adjusting the coding model had no significant effects.
$(\epsilon, \delta)$-Differential Privacy
With the default \epsilon value of 2 and a \delta value of
10^{-6}, the performance was really good.
Re-identification risk
All indicators for risk by each attacker model were between 0.1% and 0.9%.
Utility
The original Classification Performance was 83.24% and it remained at 80.97%.
Nearly 16% of attributes are missing, with the expection of age and
education-num, which are 100% missing.
Effect of parameters
An \epsilon value of 3 maintained the accuracy at 80.5% with
missings values rounding 32%.
An increase of \delta to 10^{-5} resulted in a classification
performance of 82.05% and a missings value of 21.02% for all attributes.
A further increase of \delta to 10^{-4} resulted in an increased
accuracy of 82.32%, but a maximal risk of 1.25%.
Results
$(\epsilon, \delta)$-Differential Privacy resulted in more missing attributes, leading to a lower precision, hence we opted for k-Anonymity, despite the higher maximal risk.
The 8-anonymity model was chosen as it resulted in a broader
distribution of attribute values like age, whereas with Differential
Privacy, they were split into only 2 categories.
Observations
We noted that the contingency between sex and relationship maintained
the same distribution after anonymization, meaning that these changes don't
mean relationship can identify an individual's sex any more than in the
original dataset.
With the following commands, we noted some possible errors in the
original dataset, where the sex and relationship attributes didn't
map entirely one to one: there was one occurence of (Husband, Female)
and two of (Wife, Male). It's possible this is an error in the
original dataset.
$ cat adult_data.csv | tail -n +2 | sed -r 's/,([^ ])/\t\1/g' |
cut -d',' -f8,10 | sort | uniq -c | sort -n

      1  Husband, Female
      2  Wife, Male
    430  Other-relative, Female
    551  Other-relative, Male
    792  Unmarried, Male
   1566  Wife, Female
   2245  Own-child, Female
   2654  Unmarried, Female
   2823  Own-child, Male
   3875  Not-in-family, Female
   4430  Not-in-family, Male
  13192  Husband, Male
$ cat anonymized.csv | tail -n +2 | sed -r 's/,([^ ])/\t\1/g' |
cut -d';' -f8,10 | sort | uniq -c | sort -n | column -s ';' -t

   1295 {Husband, Wife}              Female
   2264 {Other-relative, Own-child}  Female
   2981 {Other-relative, Own-child}  Male
   3280 *                            *
   4391 {Unmarried, Not-in-family}   Male
   5713 {Unmarried, Not-in-family}   Female
  12637 {Husband, Wife}              Male
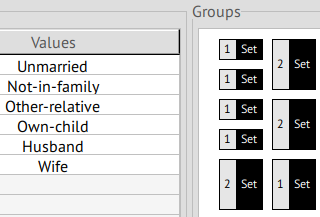
Since there were occurences of (Wife, Male), "({Husband, Wife}, Male)"
does not undo the transformation of the relationship attribute.
References
-
Sweeney, L.: Achieving k-anonymity privacy protection using generalization and suppression. J. Uncertain. Fuzz. Knowl. Sys. 10 (5), p. 571-588 (2002
-
Iyengar, V.: Transforming data to satisfy privacy constraints. Proc. Int. Conf. Knowl. Disc. Data Mining, p. 279-288 (2002)
-
Bayardo, R., Agrawal, R.: Data privacy through optimal k-anonymization. Proc. Int. Conf. Data Engineering, p. 217-228 (2005).
-
LeFevre, K., DeWitt, D., Ramakrishnan, R.: Mondrian multidimensional k-anonymity. Proc. Int. Conf. Data Engineering (2006).


